Data is changing our world and the way we live at an unprecedented rate, Experian’s 2020 Global Data Management report says "85% of organisations see data as their most valuable asset". The amount of data collected, stored and analysed daily is increasing exponentially, and technologies and storage capacities are becoming more advanced year by year. IDCs Data Age report forecasts 175 Zettabytes of data by 2025, if this was stored on DVDs, the stack of DVDs would circle Earth 222 times.
However, data has no value unless information can be extracted and transformed into knowledge. Data Analytics uncovers meaningful and useful insights by discovering relationships within data, detecting patterns, and most importantly extracting insight.What is Data Analytics
Types of data analytics commonly used are:
- Descriptive - summarising historical data and analysing for patterns and trends
- Predictive - predicting the future based on historical trends using algorithms, machine learning and artificial intelligence
- Prescriptive - identifying the best action in a scenario, emphasising actionable insights instead of data monitoring
Effective data analytics allows for the identification of new business opportunities, more efficient use of limited resources and improved decision making in a timely and actionable manner. In a highly competitive world with increasing economic pressure, it is key for businesses to utilise their data to give them an extra advantage in the market.
Data Analytics using COVID-19 Data
Luna Connect has created a real-time data analytics dashboard using publicly available datasets from the Government of Ireland's COVID-19 Data Hub. Scorecards, charts and time series on confirmed cases and deaths, as well as breakdowns by age groups, gender and transmission type, can all be viewed. Confirmed cases and deaths can be filtered for analysis by region.
The full interactive dashboard can be accessed here COVID-19 in Ireland 📊. Below are examples of the Data Analytics performed on the raw data available on COVID-19 in Ireland.
National Summary
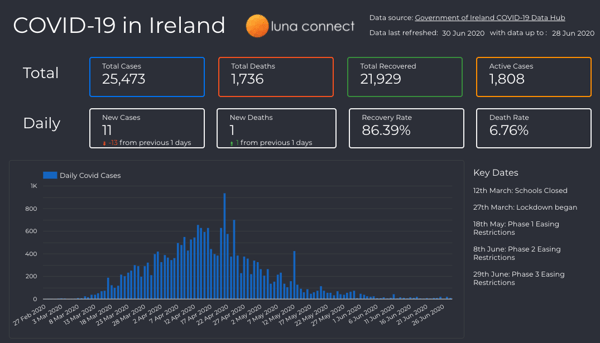
Scorecards provide aggregations for total and daily numbers, and time series analysis show trends.
Figure 1: National summary, from March to June 2020 (the full interactive dashboard can be accessed here COVID-19 in Ireland 📊)
Mode of Transmission
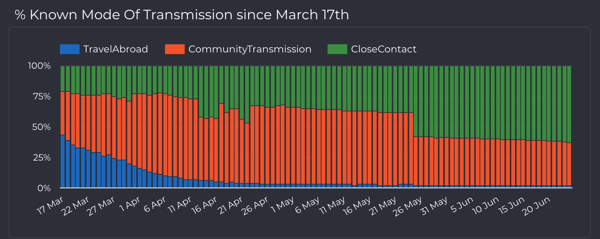
Mapping the mode of transmission you can clearly see that travel abroad was the main source of transmission in the early stages which reduced as travel restrictions were implemented.
Figure 2: National summary by transmission type, from March to June 2020 (the full interactive dashboard can be accessed here COVID-19 in Ireland 📊)
Cases by Region
Analysing multiple metrics side by side gives greater insights, for example Dublin has the highest number of case, however Cavan has the highest number of cases per 100K population. The use of geo-maps show a new cluster in the north west.
 Figure 3: Analysis of cases by county, from March to June 2020 (the full interactive dashboard can be accessed here COVID-19 in Ireland 📊)
New Cases per Week
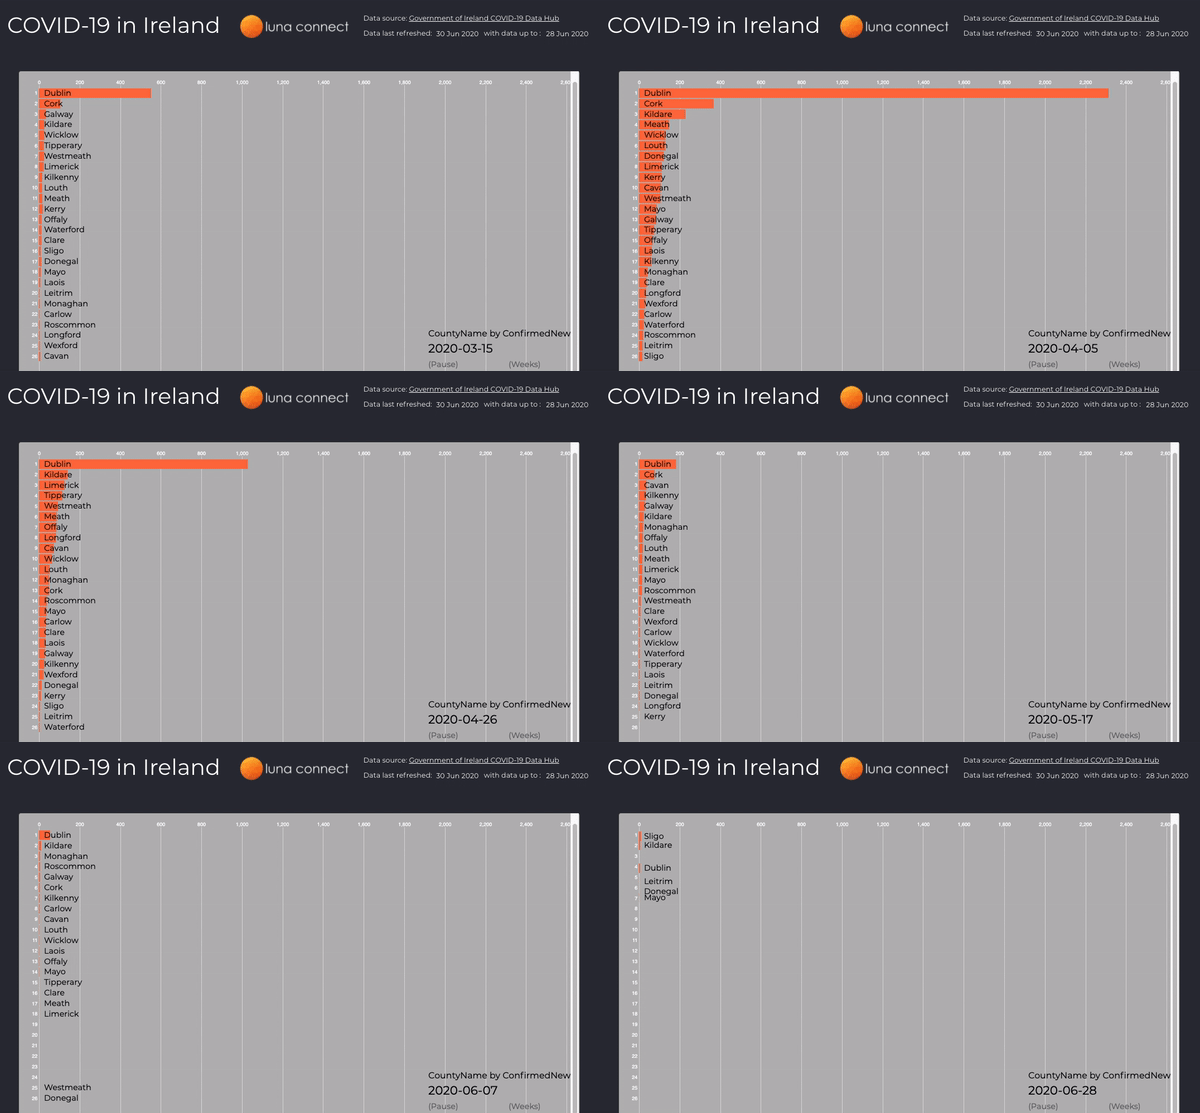
Use of animations when analysing data can tell a story better than static graphs, here the number of new cases per week is displayed in an animated bar chart, you can easily identify where new clusters occur and how quickly they are contained.

Figure 4: New case by county, per week, from March to June 2020 (the full interactive dashboard can be accessed here COVID-19 in Ireland 📊)
A massive amount of data about the COVID-19 pandemic is generated every day and there is a heightened emphasis on gathering and accessing quality data. Data Analytics for COVID-19 is now more important than ever, to help governments make informed decisions that maximize beneficial outcomes for public health and humanity.
Data Analytics and Digital Transformation
The COVID-19 pandemic is fast-tracking digital transformation across the globe and the ability to leverage big data is increasingly critical for decision making and business survival. Technology and data analytics is vital in the fight against COVID-19 and future pandemics. In addition to being able to support modeling efforts and predicting the flow of a pandemic, big data, machine learning, and other technology can quickly and effectively analyse data to help humanity prepare and respond to this and future pandemics.
Although human activity has slowed down due to the COVID-19 pandemic, businesses can survive by adopting a digital approach and effectively utilising their data to explore new opportunities and ensure business stability to thrive in the post-pandemic world.
Working with data can bring many challenges too. Data preparation techniques such as data cleaning, data transformation, and data quality can take a significant amount of time before analysing the data. Data can be structured, semi-structured or unstructured and it is important to be able to manage, link, match or transform different varieties and types of data.
Data Analytics and Lending
Luna Connect is a data driven lending platform helping customers drive operational change, reduce costs and provide faster lending decisions with real time quality data and artificial intelligence. Luna Connect's digital platform provides lenders with an end-to-end solution that allows borrowers to complete the entire process online, remotely. Not only will this keep borrowers safe at home, the loan-application process is more straightforward and result in a faster lending decision. Digital transformation and Data Analytics is more important than ever for businesses now, to survive the COVID-19 pandemic.


